See every dependency, every event.
Audit-log plugin for samber/do v2. Track every registration, invocation, and shutdown with timestamps, dependency graphs, and self-contained HTML visualization.
package main

import (
    "os"

    auditlog "github.com/LarsArtmann/samber-do-auditlog"
    "github.com/samber/do/v2"
)

func main() {
    plugin, err := auditlog.New(auditlog.Config{
        Enabled:     true,
        ContainerID: "my-app",
    })
    if err != nil {
        panic(err)
    }

    injector := do.NewWithOpts(plugin.Opts())

    // Register and invoke services as usual
    do.Provide(injector, func(i do.Injector) (*Database, error) {
        return &Database{}, nil
    })
    do.MustInvoke[*Database](injector)

    // Export when ready
    plugin.ExportToHTML("audit.html")
    plugin.Report().WriteMermaid(os.Stdout)
}What does it look like?
One self-contained HTML file. No server, no runtime dependencies, no external requests.
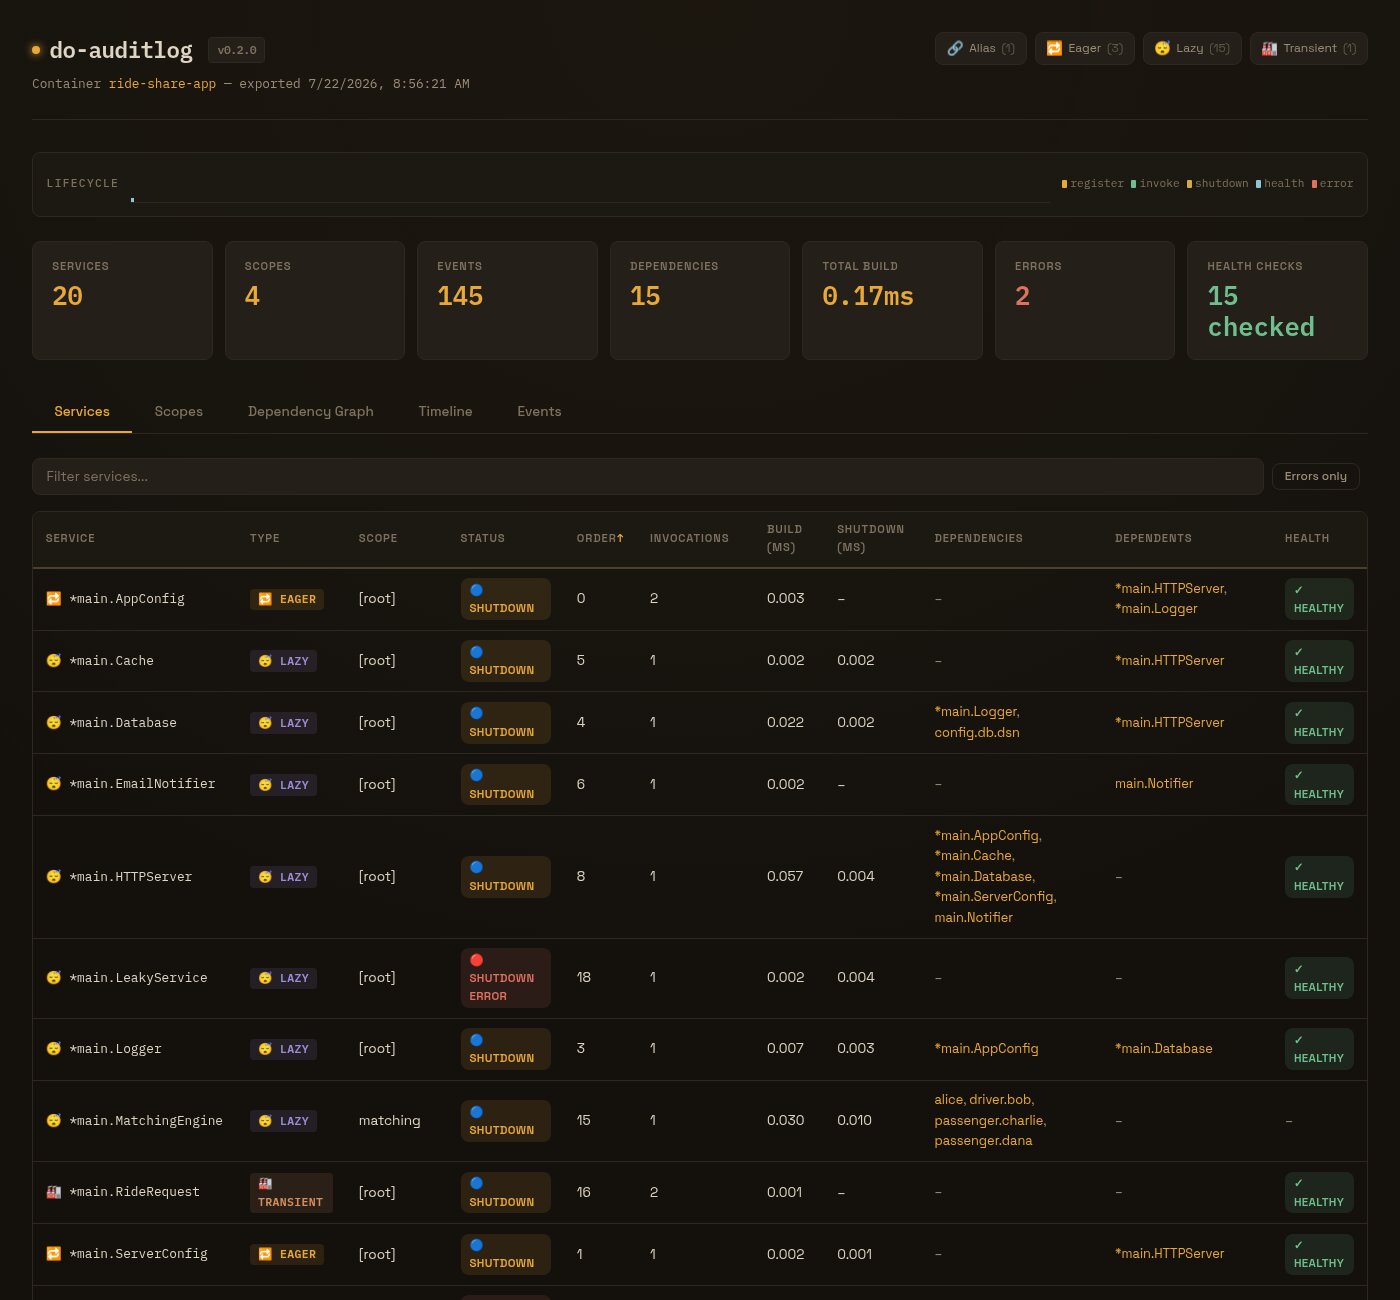
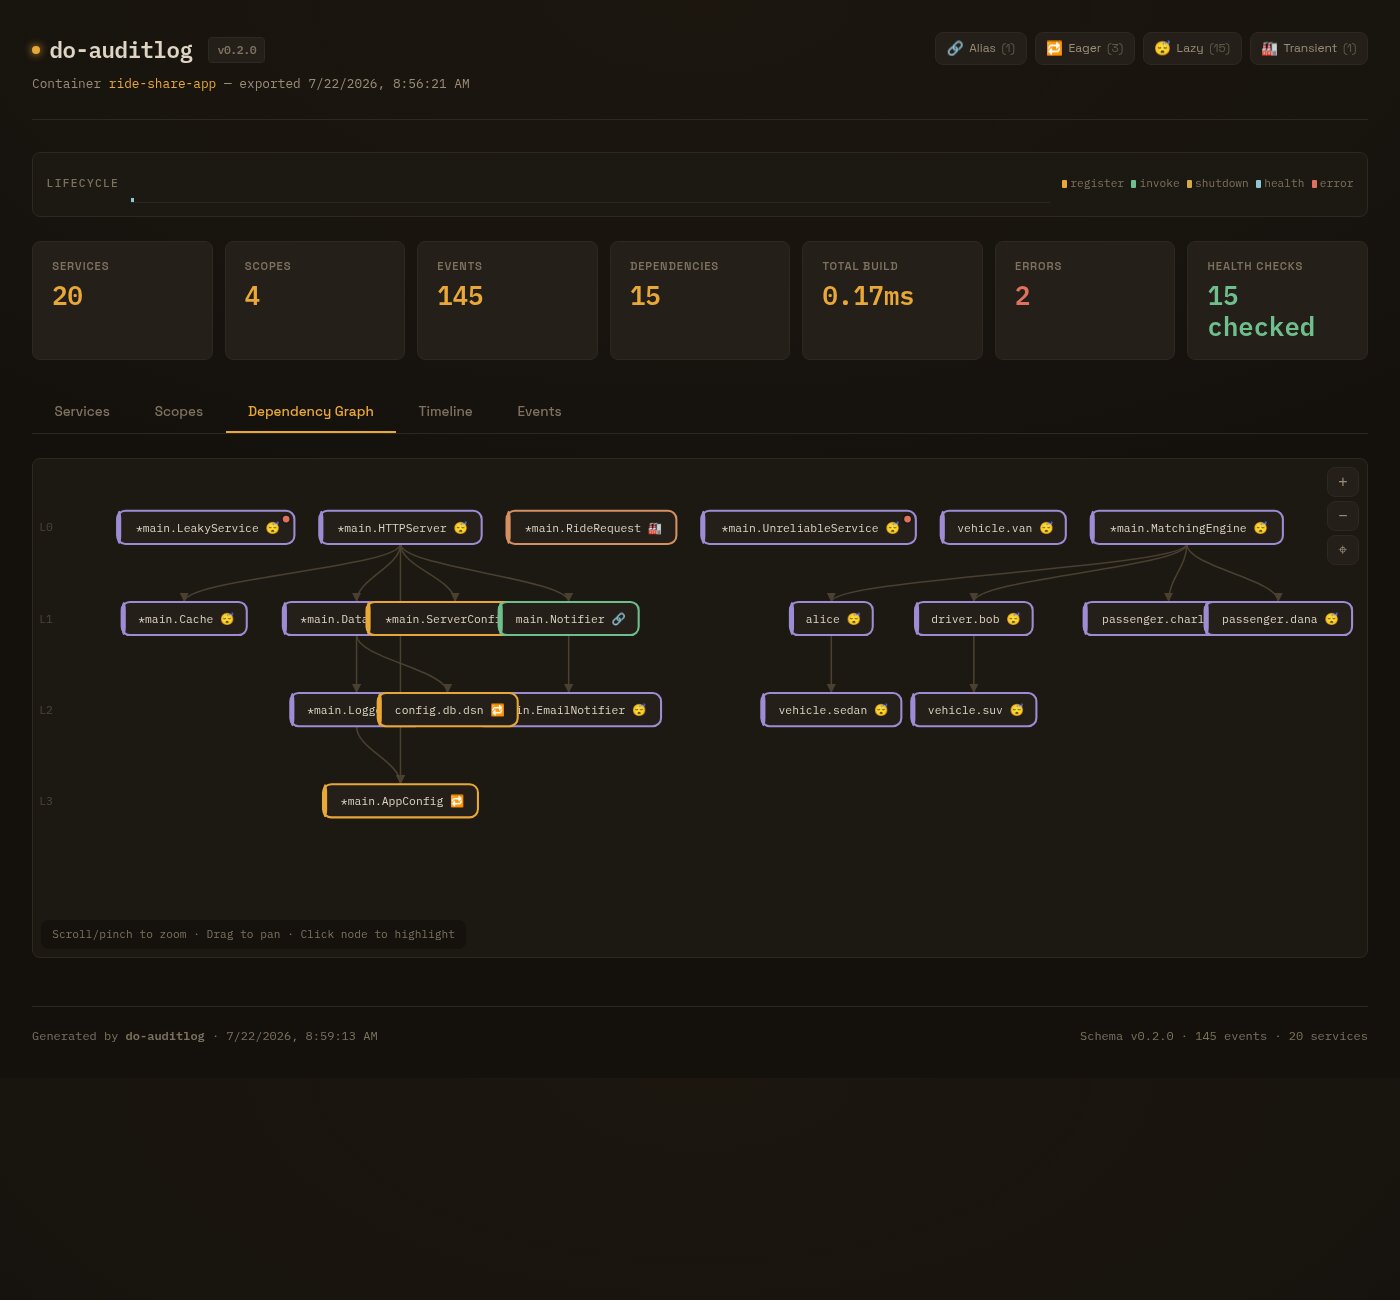
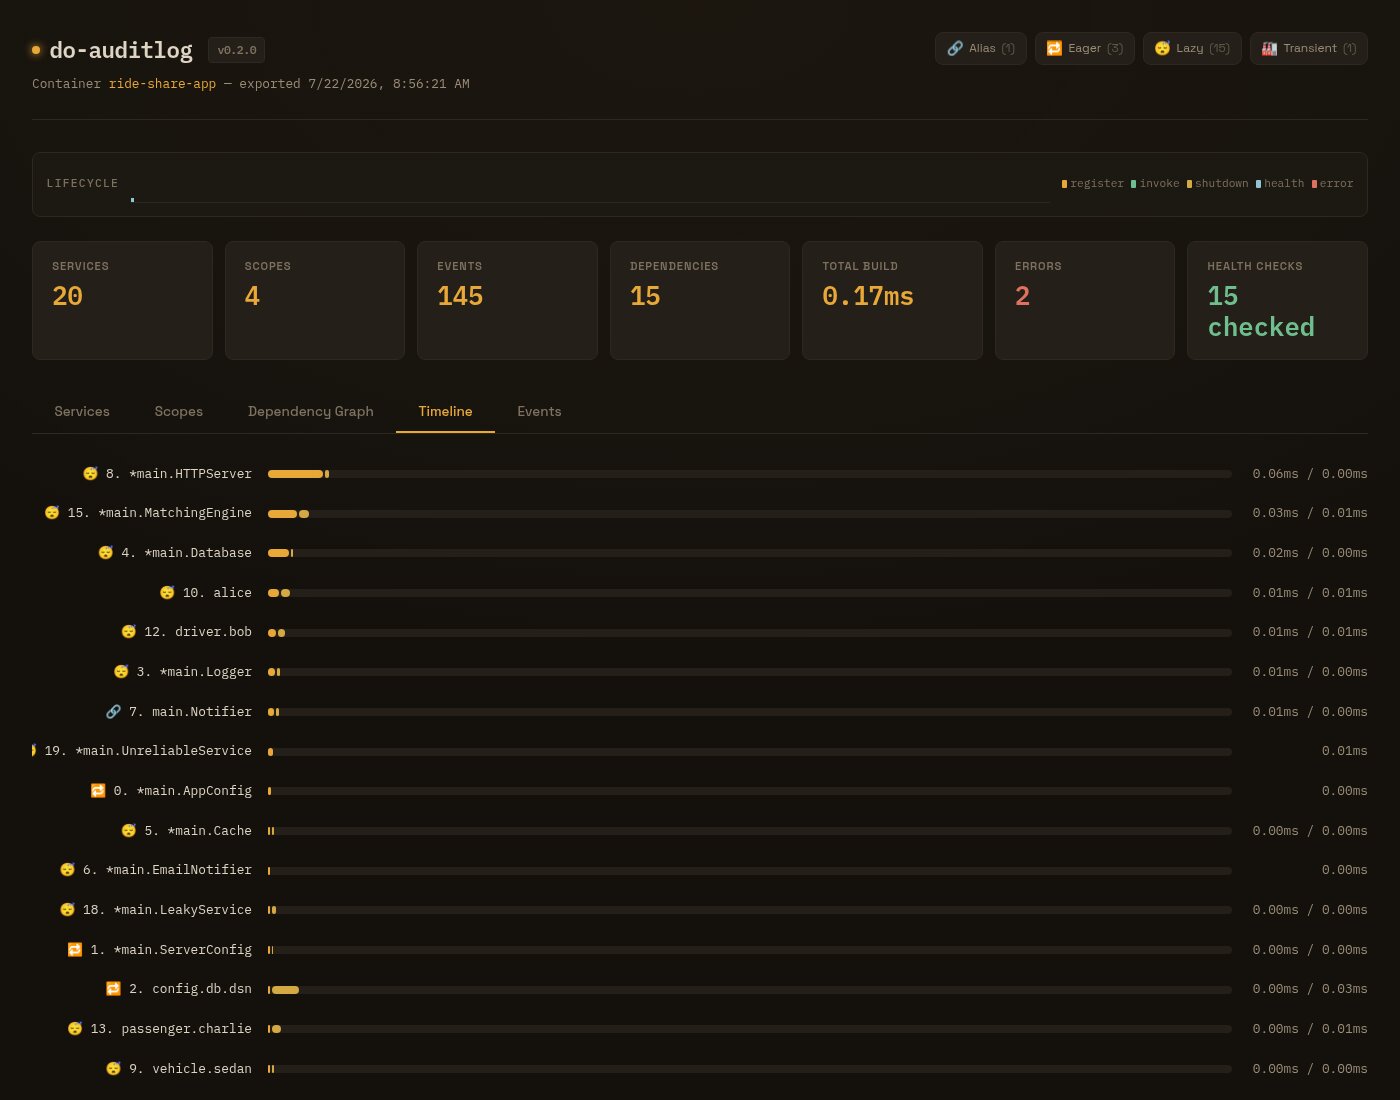
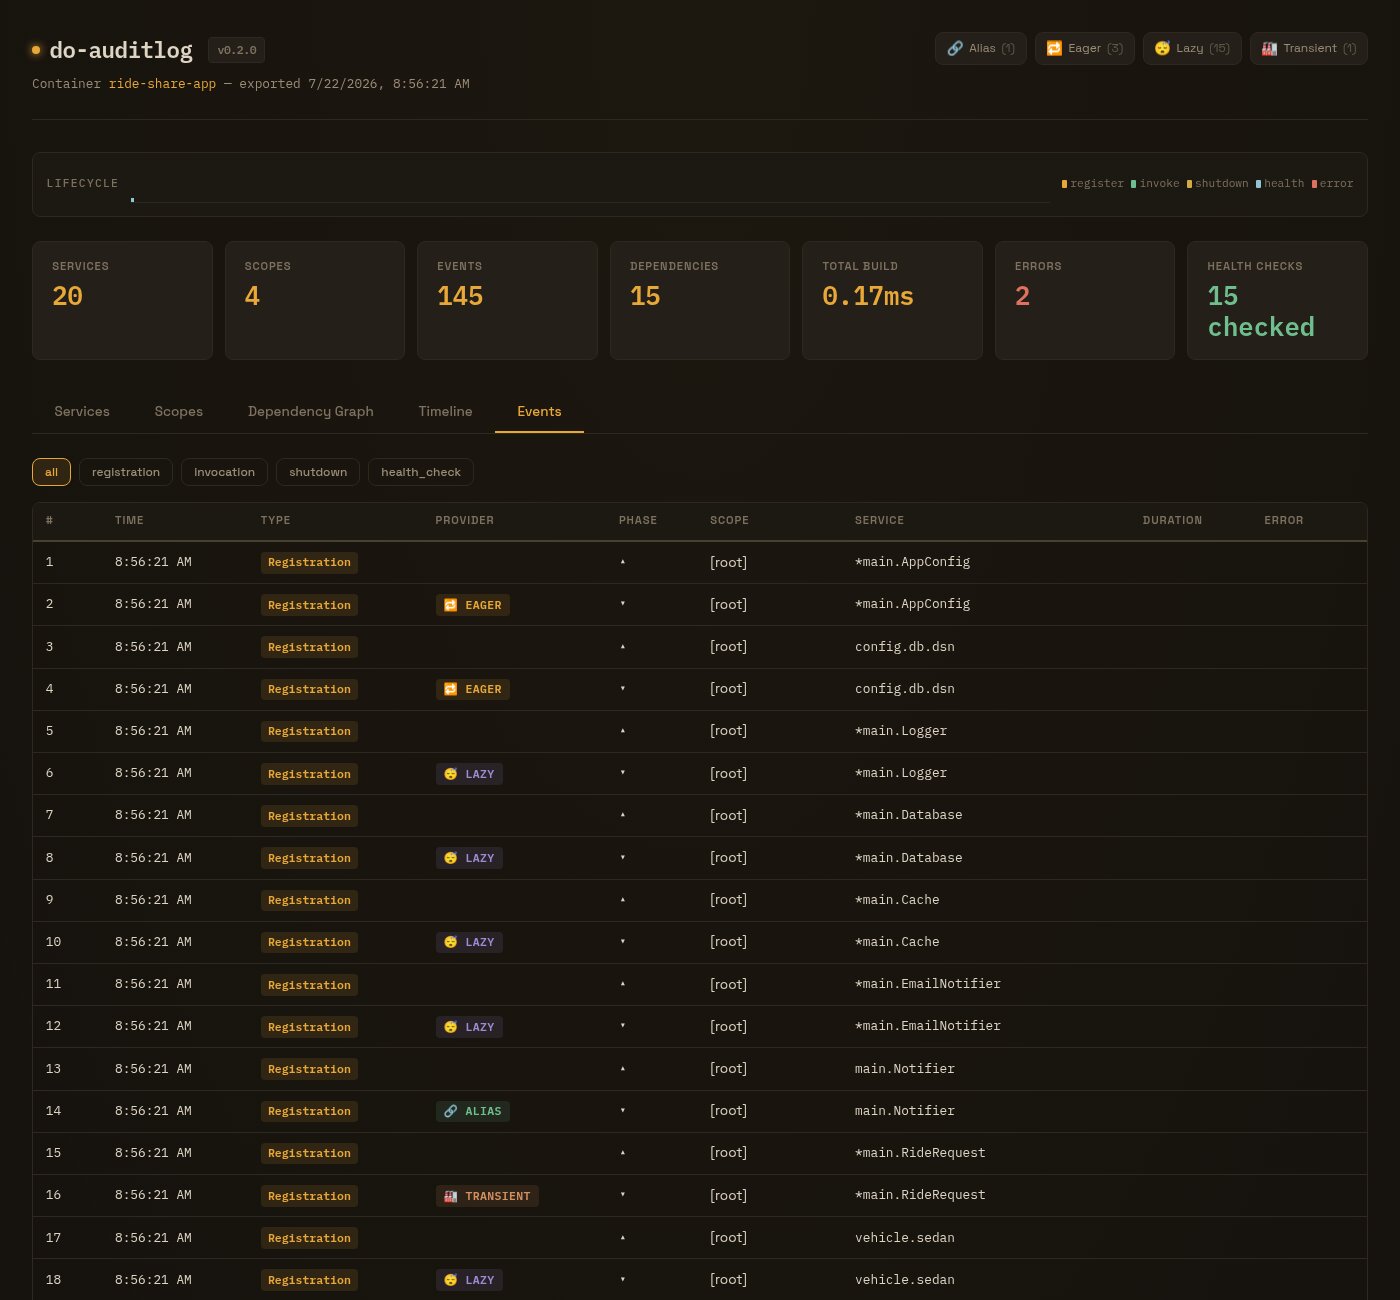
Everything you need to audit your DI container.
Drop-in observability with zero ceremony.
Drop-in Setup
One line: do.NewWithOpts(plugin.Opts()). Zero config, zero ceremony.
Dependency Graph
Infers which service resolved which — forward and reverse — without touching do's internals.
Scope Tree
Full hierarchy with per-scope service lists, cross-scope resolution tracked automatically.
16+ Export Formats
JSON, NDJSON, CSV, TSV, HTML, Mermaid, PlantUML, DOT, D2, tree, and table.
Health Check Audit
Wraps injector.HealthCheck() with per-service events and unhealthy-service detection.
~1.7us Overhead
In-memory capture during operation. Toggle off for zero cost. Export only when you need it.
Try it in 30 seconds.
Clone the repo and run the self-checking example.
The example exercises every major samber/do v2 feature - eager and lazy providers, named services, transients, aliases, child scopes, cross-scope dependencies, health checks, and shutdown errors - then writes an HTML report you can open in any browser.
How it works.
Three steps from zero to full observability.
Create the Plugin
Pass plugin.Opts() to do.NewWithOpts. Hooks fire on every registration, invocation, and shutdown.
Run Your Container
The plugin captures events in memory with an invocation stack that infers the dependency graph.
Export & Visualize
Get a JSON snapshot, NDJSON event stream, or a self-contained HTML page. Or render Mermaid, DOT, D2, PlantUML.
Why do-auditlog?
Purpose-built for samber/do v2 observability.
Built for real debugging.
Drop it into any Go service using samber/do.
Debugging
Spot circular dependencies and slow builds instantly
Observability
Stream events to Prometheus, OTel, or live dashboards
CI / CD
Export reports as build artifacts for audit trails
Performance
Profile first-build durations and invocation counts
Start auditing in seconds.
One line to unlock full DI container observability.